文章解析:谭永飞. 通过共表达网络分析 (WGCNA) 探究前列腺癌发生与进展相关功能基因模块 . MS thesis. 吉林大学, 2018.
数据来源:TCGA(The Cancer Genome Atlas) (https://portal.gdc.cancer.gov/ )
一、数据下载与处理 文章使用了TCGA-Assembler的R程序包下载TCGA规范化处理过后的LV3开放前列腺癌数据和临床信息总共553个癌症样本文件,包括正常样本52个,癌症样本501个。分别下载这553个样本的count以及FPKM数据和临床信息。
参考安装文章:https://cloud.tencent.com/developer/article/1481868
注:
level1:原始数据
level2:处理过的数据
level3:经过分割、解释的数据
level4:感兴趣的区域或概要
总而言之,前面2个层级的数据一般是拿不到的,需要权限,一般也只有国外的PI才能申请到(听说的),我们一般拿到的open数据就属于那种已经标准化后的数据。
1.源码下载 a.文件准备 最重要的文件只有两个Moudule_A.R和Moudule_B.R 所以我们把它们复制到工作文件夹下,这个Module_A主要是用来下载数据的,而Module_B主要用来分析数据;
1 2 3 4 5 6 7 8 9 mkdir workspacecd workspacegit clone https://github.com/compgenome365/TCGA-Assembler-2.git cp ./TCGA-Assembler-2/TCGA-Assembler/Module_A.R ./Module_A.Rcp ./TCGA-Assembler-2/TCGA-Assembler/Module_B.R ./Module_B.Rmkdir data
然后打开R软件,设置工作目录,直接使用代码:setwd(“/home/gc/workspace/xue”) 来实现,输入这行代码后,可通过getwd()来获取当前工作目录,确认是否设置成功,要不然后面会出错。还可通过软件直接设置:文件>>改变工作目录,然后选择刚刚那个文件路径就行了,getwd()再验证一下。
b.R包准备 加载需要用的包,安装好下面几个包以后,后续载入TCGA_assemble文件夹中的两个模块(Module_A.R和Module_B.R)时,如果提示错误,一般是缺少包,提示缺什么安装什么就行了:
(原文版本太低了)
1 2 3 4 5 6 7 8 install.packages("BiocManager" ) BiocManager::install(c("httr" , "RCurl" , "stringr" , "HGNChelper" , "rjson" )) library(httr) library(bitops) library(RCurl) library(stringr) library(HGNChelper) library(rjson)
2.下载数据 a.下载生物样本临床数据 核心代码
1 DownloadBiospecimenClinicalData(cancerType, saveFolderName = "./BiospecimenClinicalData" ,outputFileName = "" )
参数说明:
cancerType: 一个字符串,指示应为其下载数据的指定癌症类型。它的值可以是任何癌症类型的缩写,可以查看 Manual.pdf文档,也可去官网https://tcga-data.nci.nih.gov/docs/publications/tcga/ 查询各种癌症的缩写。这里列举部分出来。
cancerType
Canncer Type Full Name
ACC
Adrenocortical carcinoma
BLCA
Bladder urothelial carcinoma
BRCA
Breast invasive carcinoma
CESC
Cervical squamous cell carcinoma and endocervical adenocarcinoma
案例:
1
2
source ("Module_A.R" ) filename_biosClin <- DownloadBiospecimenClinicalData(cancerType = "BLCA" , saveFolderName ="./data/ManualExampleData/RawData.TCGA-Assembler/BiospecimenClinicalData" , outputFileName = "test" )
报错
1
2
sh: 1: curl: not found Error in system2("curl", arg, stdout = T) : error in running command
因为安装的curl在conda里面,而R包执行时是在系统里面执行,在系统里安装curl时发现有依赖问题,于是我们把conda的curl加入到环境变量里即可
1
2
3
4
5
whereis curl sudo vim ~/.bashrc export PATH="/home/gc/anaconda3/bin/curl:$PATH " source ~/.bashrc
或者解决依赖关系
1
2
apt-get purge libcurl4 apt-get install curl
b 下载拷贝数据 1 DownloadCNAData(cancerType, assayPlatform = NULL, tissueType = NULL, saveFolderName = "." ,outputFileName = "" , inputPatientIDs = NULL)
参数说明:
cancerType: 同上
assayPlatform: 一个字符向量,指示应下载数据的分析平台。它的值可以是cna_cnv.hg18, cna_cnv.hg19, cna_nocnv.hg18, 和cna_nocnv.hg19中的一个或一个组合,它的默认值是NULL,这表示上面所有的测试平台(如果可用)。关于测序平台可参考下表:
assayPlatform
Assay
Reference Genome
Additional Description
Filename Pattern
cna_cnv.hg18
Affymetrix SNP Array 6.0
Hg18
All probes
cna_cnv.hg19
Affymetrix SNP Array 6.0
Hg19
cna_nocnv.hg18
Affymetrix SNP Array 6.0
Hg18
cna_nocnv.hg19
Affymetrix SNP Array 6.0
Hg19
下载失败,因为旧数据已被清除,于是只能到官网 下载,查找TCGA-PRAD得到498个病例
下载manifest文件,然后到服务器上下载拉取的客户端
1
2
3
wget https://gdc.cancer.gov/files/public/file/gdc-client_v1.6.1_Ubuntu_x64.zip unzip gdc-client_v1.6.1_Ubuntu_x64.zip ./gdc-client download -m gdc_manifest.2024-03-05.txt
数据下载完成
3.数据预处理 a. 进行FPKM进行数据归一化 (每千个碱基的转录每百万映射读取的fragments)。通俗讲,把比对到的某个基因的Fragment数目,除以基因的长度,其比值再除以所有基因的总长度。FPKM可以排除因基因长度、测序深度等因素造成的干扰。
定义表达基因为:在所有肿瘤样本中,FPKM>1的样本数>80%的总肿瘤/总瘤旁组织样本数
参考https://blog.csdn.net/weixin_49878699/article/details/135373467
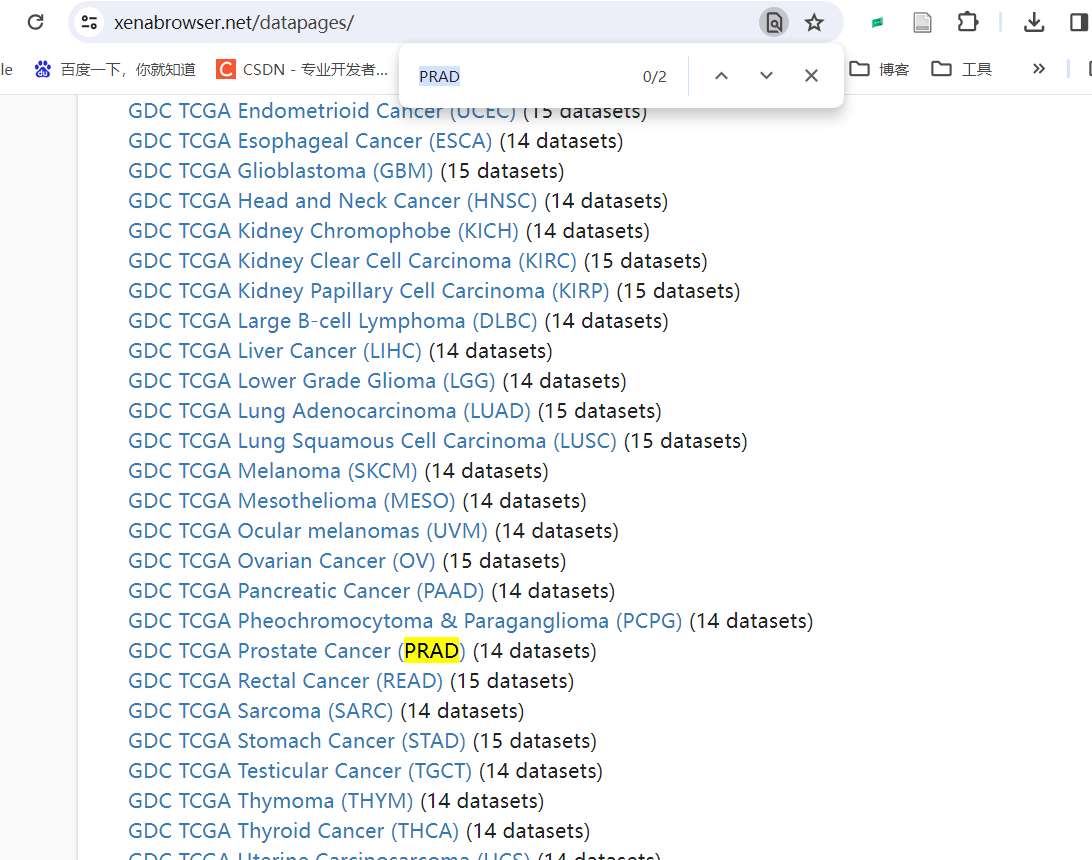
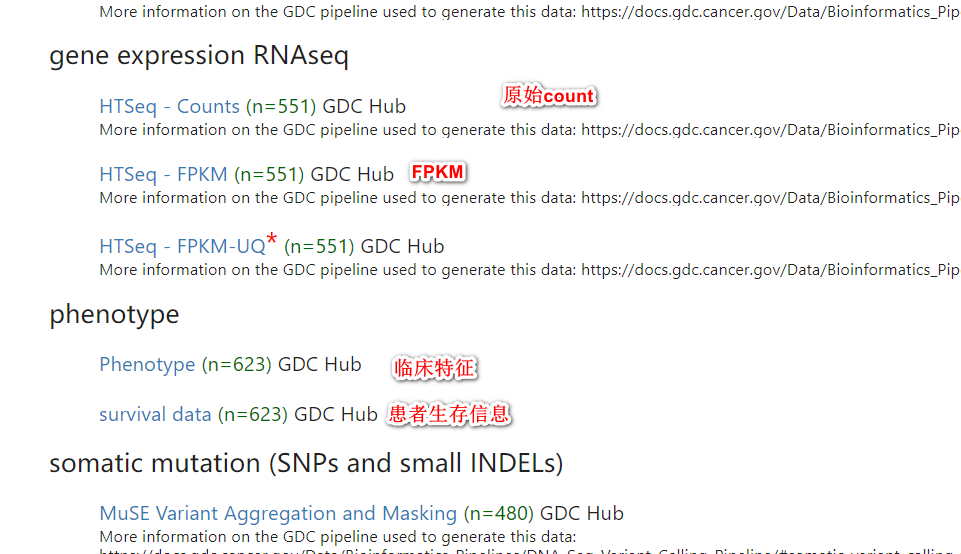
在学习过程中发现了有处理过后的数据网站,XENA.UCSC ,其就是很直观强大的一个在线网站,里面收录了众多数据库的数据集,其中就包括了TCGA数据集,并且是整合好的,可以直接用于分析。
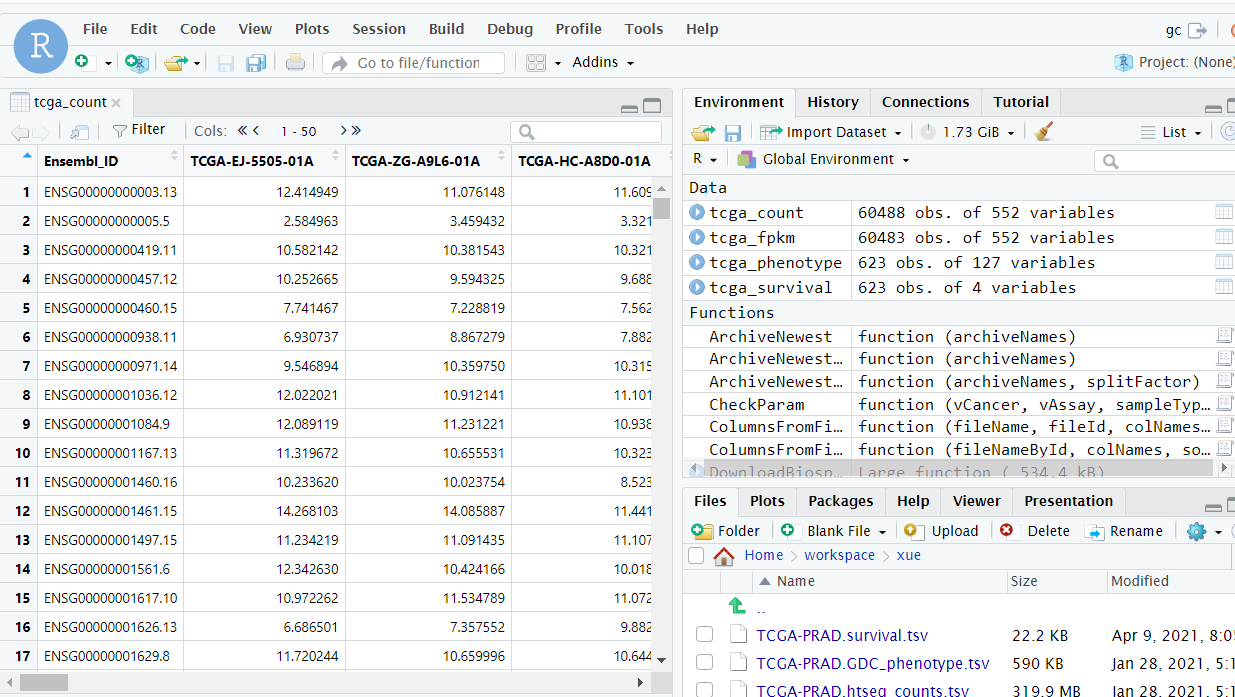
counts——转录组的原始表达矩阵,里面对应的基因表达量又被称作raw_count,行名为基因symbol,列名为样本名(也是病人的id,可以将每一列看作一个病人)
b.进行注释/FPKM 首先安装要用的包
1 2 3 4 BiocManager::install(c("tidyverse" , "dplyr" , "rtracklayer" )) library(tidyverse) library(dplyr) library(rtracklayer)
1 2 3 4 5 6 7 8 9 tcga_count <- read_tsv(file = './TCGA-PRAD.htseq_counts.tsv' ) tcga_fpkm <- read_tsv(file = "./TCGA-PRAD.htseq_fpkm.tsv" ) tcga_survival <- read_tsv(file = "./TCGA-PRAD.survival.tsv" ) tcga_phenotype <- read_tsv(file = "./TCGA-PRAD.GDC_phenotype.tsv" ) tcga_count <- as.data.frame(tcga_count) tcga_count <- column_to_rownames(tcga_count, var = 'Ensembl_ID' ) tcga_count <- 2^tcga_count-1
接下来要导入一个比较重要的文件gencode.v26.annotation.gtf 它是人类标准基因组注释文件(第27版GRCh38.p10),可以看到其中的v26,是第26个版本,下载地址如下,选择网址里面的第一个,只含有人类基因的
1
2
3
[https://www.gencodegenes.org/human/release_26.html](https://www.gencodegenes.org/human/release_26.html) wget https://ftp.ebi.ac.uk/pub/databases/gencode/Gencode_human/release_26/gencode.v26.annotation.gtf.gz gzip -d gencode.v26.annotation.gtf.gz
然后导入
1
2
3
4
gene_annotation <- import('./gencode.v26.annotation.gtf' ) gene_annotation <- as.data.frame(gene_annotation) gene_annotation <- gene_annotation [gene_annotation$type == 'gene' , ] gene_annotation <- dplyr::select(gene_annotation, gene_id, gene_name, seqnames, start, end, width, strand, gene_type)
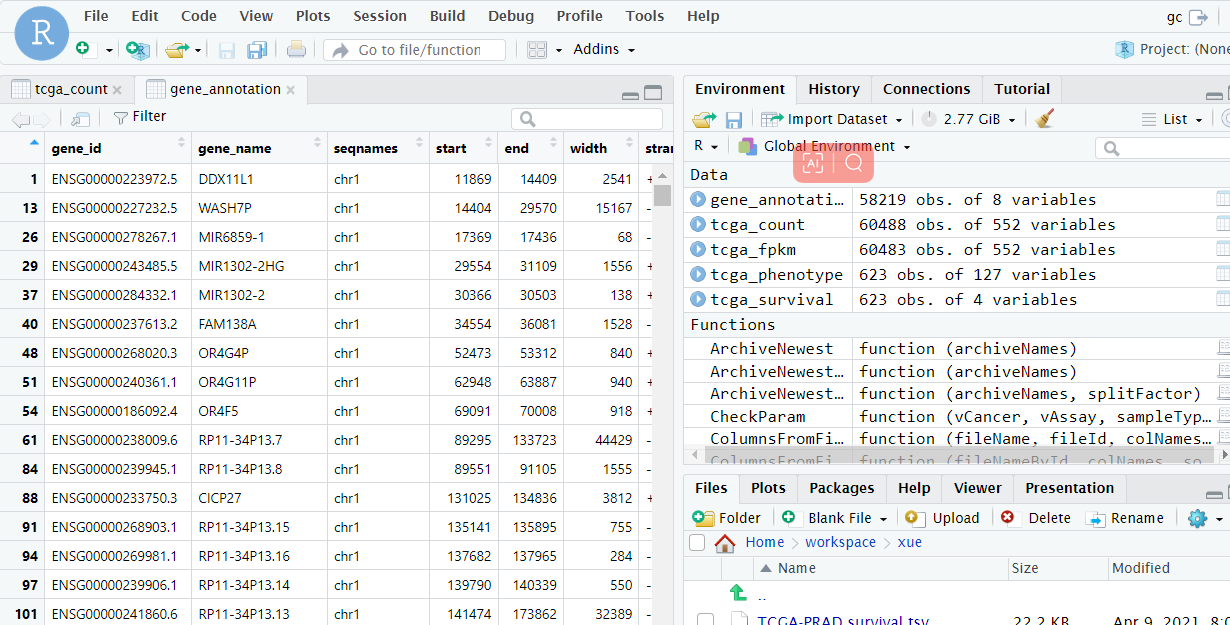
看看最后处理好的gene_annotation长啥样,点击Rstudio右上角的gene_annotation 如下图所示:
gene_id——基因的ensemble_ID
这里我们用到的是前两列gene_id和gene_name
1
2
gene_symbol <- gene_annotation[,(1:2)] colnames(gene_symbol) <- c("ID" , "symbol" )
准备好前面的count数据和基因注释文件后,运行下面代码,每句代码后都有注释信息,可以挨个查看,比对处理前后的变化
1
2
3
4
5
6
7
8
9
10
11
12
13
14
data_tcga <- tcga_count data_tcga$ID <- rownames(data_tcga) data_tcga$ID <- as.character(data_tcga$ID ) gene_symbol$ID <- as.character(gene_symbol$ID ) data_tcga <- inner_join(data_tcga, gene_symbol, by = "ID" ) data_tcga <- dplyr::select(data_tcga, -ID) data_tcga <- dplyr::select(data_tcga, symbol, everything()) data_tcga <- mutate(data_tcga, rowMean=rowMeans(data_tcga[grep('TCGA' ,names(data_tcga))])) data_tcga <- arrange(data_tcga, desc(rowMean)) data_tcga <- distinct(data_tcga, symbol, .keep_all = T) data_tcga <- dplyr::select(data_tcga, -rowMean) data_tcga <- tibble::column_to_rownames(data_tcga, var = "symbol" ) dim(data_tcga)
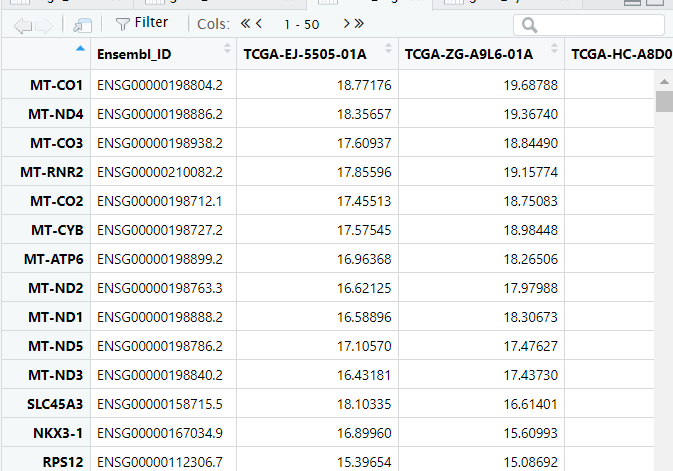
上面的代码说白了就是一个去重加基因注释,结果如下图所示,行为基因symbol,列为样本名,但是同样每个样本后有个01A和11A这个是与癌症相关的,01-09为肿瘤,10-19为正常对照。
接下来根据样本最后的这个数字初步筛选癌症和对照样本
1 2 3 4 5 6 7 8 9 10 11 12 13 14 15 16 17 18 19 20 21 22 mete <- data.frame(colnames(data_tcga)) for (i in 1:length(mete[, 1])) { num <- as.numeric(as.character(substring(mete[i, 1], 14, 15))) if (num %in % seq (1, 9)){mete[i, 2] = "T" } if (num %in % seq (10, 29)){mete[i, 2] = "N" } } colnames(mete) <- c("id" , "group" ) table(mete$group ) mete$group <- as.factor(mete$group ) mete <- subset(mete, mete$group == "T" ) exp_tumor <- data_tcga[, which (colnames(data_tcga) %in % mete$id )] exp_tumor <- as.data.frame(exp_tumor) exp_tumor <- exp_tumor[, colnames(exp_tumor) %in % tcga_survival$sample ] exp_control <- data_tcga[, which (!colnames(data_tcga) %in % mete$id )] exp_control <- as.data.frame(exp_control) exp_control <- exp_control[, colnames(exp_control) %in % tcga_survival$sample ] data_final <- cbind(exp_control, exp_tumor) data_final <- na.omit(data_final)
虽然已经根据样本ID可以区分肿瘤样本和正常样本,但是为了确保分组可靠,接下来依据前面导入的临床信息(tcga_phenotype)进一步确认分组
1 2 3 4 5 6 7 8 9 10 11 12 13 table(tcga_phenotype$sample_type .samples) table(tcga_phenotype$primary_site ) clinical_data <- subset(tcga_phenotype, sample_type.samples == 'Primary Tumor' | sample_type.samples == 'Solid Tissue Normal' ) clinical_data <- clinical_data[clinical_data$submitter_id .samples %in % colnames(data_final), ] clinical_data <- clinical_data[order(clinical_data$sample_type .samples, decreasing = T), ] Group <- data.frame(sample = clinical_data$submitter_id .samples, group = clinical_data$sample_type .samples) Group$group <- ifelse(Group$group == 'Solid Tissue Normal' , 'control' , 'disease' ) data_final <- subset(data_final, select = Group$sample ) table(Group$group )
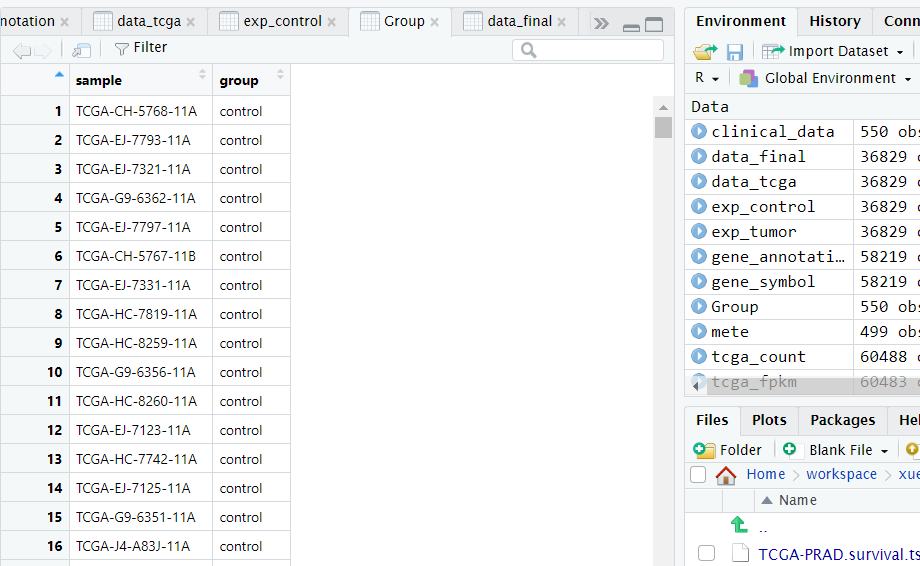
如下图所示是整理好的分组信息,第一列是样本的ID,需要和前面整理好的count数据集中的样本ID对应,第二列为样本所属的分组
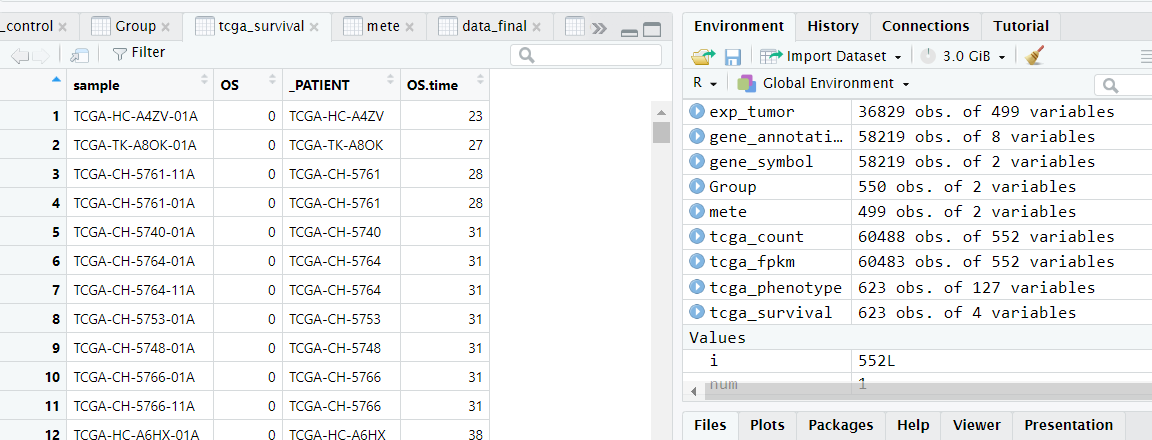
目前我们已经得到了整理好的count数据以及样本的分组信息,目前还差样本对应的生存信息和fpkm表达矩阵,样本的生存信息比较好处理,如下图所示为导入的样本生存信息,第一列和第三列都是样本ID,第二列OS是患者的生存状态,0表示存活,1表示死亡,第四列OS.time是患者的生存时间。
此时只需要去除掉第三行并且让生存信息表中患者的ID和前面整理好的分组信息表中的患者ID做个匹配即可,最后将整理好的count,group,以及生存信息表保存成csv格式即可。
1
2
3
4
5
6
7
tcga_survival <- tcga_survival[, -3] tcga_survival <- tcga_survival[tcga_survival$sample %in % Group$sample , ] write.csv(tcga_survival, './data_survival.csv' ) write.csv(clinical_data, './data_clinical.csv' ) write.csv(data_final, file = './data_count.csv' ) write.csv(Group, file = './data_group.csv' )
最后一步就是处理fpkm数据,这是因为在后续分析中除了差异表达分析会用到count数据,其余很多情况用的都是fpkm数据。处理的代码如下,其实整体思路和前面处理count时差不多,最后将结果保存为.csv形式即可。
1 2 3 4 5 6 7 8 9 10 11 12 13 14 15 16 17 18 19 20 21 22 23 24 25 26 tcga_fpkm <- as.data.frame(tcga_fpkm) tcga_fpkm <- column_to_rownames(tcga_fpkm, var = 'Ensembl_ID' ) tcga_fpkm <- 2^tcga_fpkm-1 dat_fpkm <- tcga_fpkm dat_fpkm$ID <- rownames(dat_fpkm) dat_fpkm$ID <- as.character(dat_fpkm$ID ) dat_fpkm<-dat_fpkm %>% inner_join(gene_symbol,by='ID' )%>% select(-ID)%>% select(symbol,everything())%>% mutate(rowMean=rowMeans(.[grep('TCGA' ,names(.))]))%>% arrange(desc(rowMean))%>% distinct(symbol,.keep_all = T)%>% select(-rowMean)%>% tibble::column_to_rownames(colnames(.)[1]) dim(dat_fpkm) dat_fpkm <- dat_fpkm[,colnames(data_final)] dat_fpkm <- na.omit(dat_fpkm) write.csv(dat_fpkm, file = './data_fpkm.csv' )
下课!!!
最后我们提取到36829个基因与原文基本类似(原文处理了一些坏数据导致比原文稍多34102)
c 差异表达基因筛选/火山图(edgeR)/热图(gplots) 教程来源https://www.jianshu.com/p/0e1ad0cc4ce6
安装包
1 2 BiocManager::install('edgeR' ) library(edgeR)
edgeR使用经验贝叶斯估计和基于负二项模型的精确检验来确定差异基因,通过在基因之间来调节跨基因的过度离散程度,使用类似于Fisher精确检验但适应过度分散数据的精确检验用于评估每个基因的差异表达。
以下是edgeR分析差异表达基因的一般过程。
把处理后的值进行分析,并且依照我们的Group进行分组
1 2 3 4 5 6 7 8 9 10 11 12 13 14 15 16 17 18 19 20 21 22 23 24 25 26 27 28 29 30 31 32 33 34 35 36 37 38 39 40 41 42 43 data_final fdr=0.05 outname="outfile" group <- rep(c(rep('control' ,52),rep('disease' ,498))) dgelist <- DGEList(counts = data_final,group=group) keep <- rowSums(cpm(dgelist) > 1 ) >= 2 dgelist <- dgelist[keep, , keep.lib.sizes = FALSE] dgelist_norm <- calcNormFactors(dgelist, method = 'TMM' ) design <- model.matrix(~group) dge <- estimateDisp(dgelist_norm, design, robust = TRUE) 1. ) fit <- glmFit(dge, design, robust = TRUE) lrt <- topTags(glmLRT(fit), n = nrow(dgelist$counts )) 2. ) mode='glmQLFTest' fit <- glmQLFit(dge, design, robust = TRUE) lrt <- topTags(glmQLFTest(fit), n = nrow(dgelist$counts )) lrt<-lrt$table gene_diff <- lrt[order(lrt$FDR , lrt$logFC , decreasing = c(FALSE, TRUE)), ] gene_diff[which (gene_diff$logFC >= 1 & gene_diff$FDR < fdr),'sig' ] <- 'up' gene_diff[which (gene_diff$logFC <= -1 & gene_diff$FDR < fdr),'sig' ] <- 'down' gene_diff[which (abs(gene_diff$logFC ) <= 1 | gene_diff$FDR >= fdr),'sig' ] <- 'non-significant' write.table(gene_diff, paste (outname,'.txt' ,sep="" ), sep = '\t' , col.names = NA, quote = FALSE) gene_diff_select <- subset(gene_diff, sig %in % c('up' , 'down' )) write.table(gene_diff_select, file = paste (outname,'.select.txt' ,sep="" ), sep = '\t' , col.names = NA, quote = FALSE)
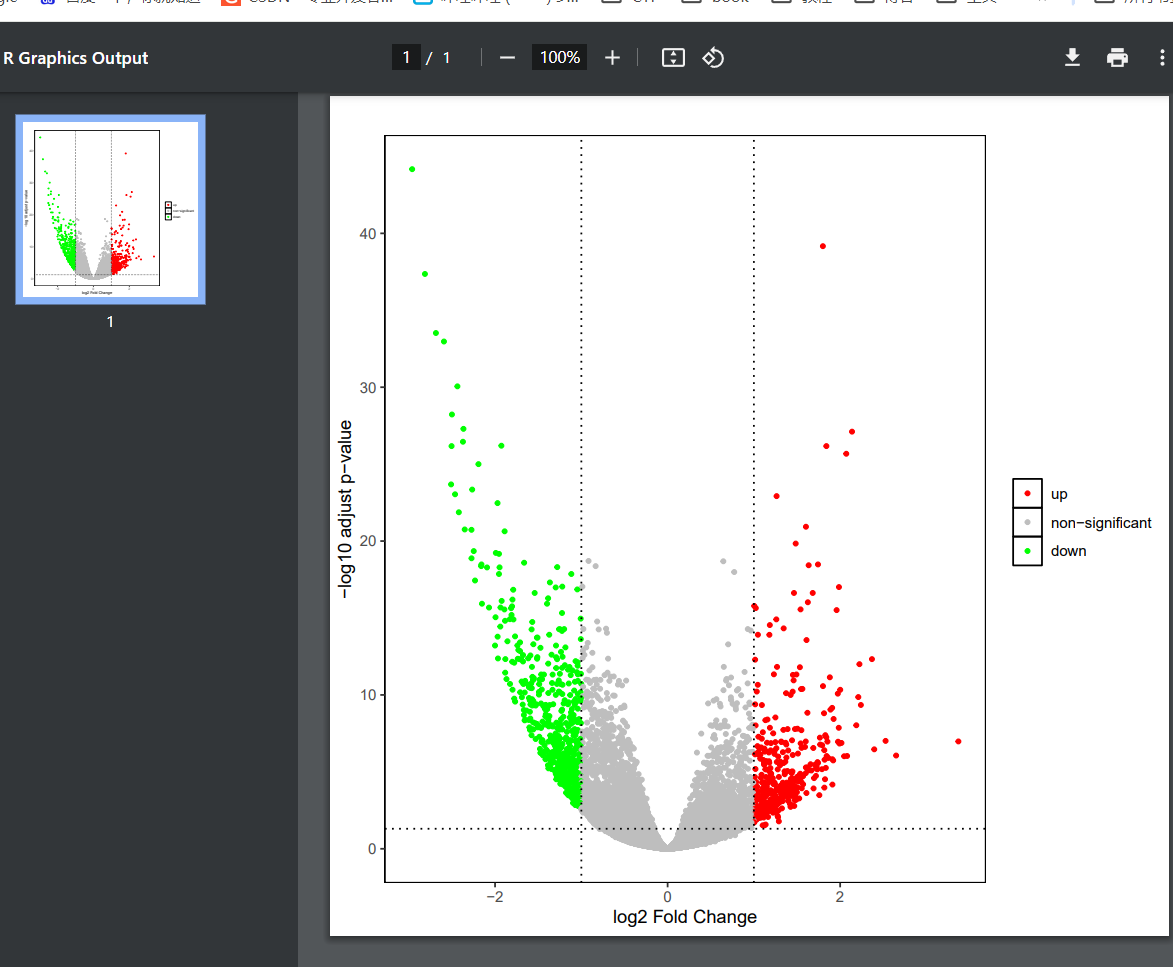
上述便可得到edgeR差异分析的基本结果了。下面可以使用ggplot绘制相应的火山图。
1
2
3
4
5
6
7
8
9
10
11
12
13
14
15
16
17
18
19
outname = "edgeRdiff" library(ggplot2) data_res1=as.data.frame(gene_diff) p <- ggplot(data = gene_diff, aes(x = logFC, y = -log10(FDR), color = sig)) + geom_point(size = 1) + scale_color_manual(values = c('red' , 'gray' , 'green' ), limits = c('up' , 'non-significant' , 'down' )) + labs(x = 'log2 Fold Change' , y = '-log10 adjust p-value' , title = '' , color = '' ) + theme(plot.title = element_text(hjust = 0.5, size = 14), panel.grid = element_blank(), panel.background = element_rect(color = 'black' , fill = 'transparent' ), legend.key = element_rect(fill = 'transparent' )) + geom_vline(xintercept = c(-1, 1), lty = 3, color = 'black' ) + geom_hline(yintercept = -log10(fdr), lty = 3, color = 'black' ) + pdf(paste (outname, ".volcano.pdf" ,sep="" )) p dev.off()
1
2
3
4
5
6
7
8
9
10
11
12
13
14
15
16
17
18
19
20
21
22
23
24
25
26
27
28
29
30
31
32
rt_sam_m <- data.frame(cbind(colnames(data_final), c(rep('control' , 52),rep('disease' ,498))), stringsAsFactors = FALSE) colnames(rt_sam_m) <- c('samples_id' , 'group' ) m_group = factor (rt_sam_m$group , levels=c('control' , 'disease' )) design_m = model.matrix(~0 + m_group) row.names(design_m) <- rt_sam_m$samples_id colnames(design_m) <- c('control' ,'disease' ) m_fit <- lmFit(data_final, design_m) cont.matrix <- makeContrasts(ControlDisease = control-disease, levels = design_m) m_fit2 <- contrasts.fit(m_fit, cont.matrix) m_fit3 <- eBayes(m_fit2) rt_diff <- topTreat(m_fit3, number = length(row.names(data_final))) rt_diff2 <- rt_diff[which (abs(rt_diff$logFC ) > 1 & rt_diff$P .Value < 0.05), ] dim(rt_diff2) library(gplots) rt_ht <- data_final[row.names(rt_diff2)[order(abs(rt_diff2$logFC ), decreasing = TRUE)], ] mat_ht <- as.matrix(apply(rt_ht, 2, function (x){as.numeric(x)})) mat_ht_z <- apply(mat_ht, 2, FUN = function (x){(x-median(x))/sd(x)}) row.names(mat_ht_z) <- row.names(rt_ht) heatmap.cols <- c(rep('blue' , 52), rep('red' , 498)) pdf(paste ("heatmap.pdf" ,sep="" )) heatmap.2(mat_ht_z, col = colorpanel(99, "blue" , "black" , "red" ), dendrogram = "both" , keysize = 1, hclustfun = function (x){hclust(x, method = 'ward.D2' )}, trace = "none" , density.info = "none" , ColSideColors = heatmap.cols) dev.off()
二、WGCNA网络搭建 参考文章:https://rstudio-pubs-static.s3.amazonaws.com/554864_6e0f44cdc1474b8ba2c5f8326559bbe4.html
1.基本概念 加权基因共表达网络分析 (WGCNA, Weighted correlation network analysis)是用来描述不同样品之间基因关联模式的系统生物学方法,可以用来鉴定高度协同变化 的基因集, 并根据基因集的内连性和基因集与表型之间的关联鉴定候补生物标记基因或治疗靶点。
相比于只关注差异表达的基因,WGCNA利用数千或近万个变化最大的基因或全部基因的信息识别感兴趣的基因集,并与表型进行显著性关联分析。一是充分利用了信息, 二是把数千个基因与表型的关联转换为数个基因集与表型的关联,免去了多重假设检验校正的问题。
理解WGCNA,需要先理解下面几个术语和它们在WGCNA中的定义。
共表达网络:定义为加权基因网络。点代表基因,边代表基因表达相关性。加权是指对相关性值进行冥次运算 (冥次的值也就是软阈值 (power, pickSoftThreshold这个函数所做的就是确定合适的power))。无向网络的边属性计算方式为 abs(cor(genex, geney)) ^ power;有向网络的边属性计算方式为 (1+cor(genex, geney)/2) ^ power; sign hybrid的边属性计算方式为cor(genex, geney)^power if cor>0 else 0。这种处理方式强化了强相关,弱化了弱相关或负相关,使得相关性数值更符合无标度网络特征,更具有生物意义。如果没有合适的power ,一般是由于部分样品与其它样品因为某种原因差别太大导致的,可根据具体问题移除部分 样品或查看后面的经验值。
Module(模块):高度內连的基因集。在无向网络中,模块内是高度相关 的基因。在有向网络中,模块内是高度正相关 的基因。把基因聚类成模块后,可以对每个模块进行三个层次的分析:1. 功能富集分析查看其功能特征是否与研究目的相符;2. 模块与性状进行关联分析,找出与关注性状相关度最高的模块;3. 模块 与样本进行关联分析,找到样品特异高表达的模块。
基因富集相关文章 去东方,最好用的在线GO富集分析工具 ;GO、GSEA富集分析一网打进 ;GSEA富集分析 - 界面操作 。其它关联后面都会提及。
Connectivity (连接度):类似于网络中 “度” (degree)的概念。每个基因的连接度是与其相连的基因的边属性之和。
Module eigengene E: 给定模型的第一主成分,代表整个模型的基因表达谱 。这个是个很巧妙的梳理,我们之前讲过PCA分析 的降维作用,之前主要是拿来做可视化,现在用到这个地方,很好的用一个向量代替了一个矩阵,方便后期计算。(降维除了PCA,还可以看看tSNE )
Intramodular connectivity: 给定基因与给定模型内其他基因的关联度,判断基因所属关系。
Module membership: 给定基因表达谱与给定模型的eigengene的相关性。
Hub gene: 关键基因 (连接度最多或连接多个模块的基因)。
Adjacency matrix (邻接矩阵):基因和基因之间的加权相关性值构成的矩阵。
TOM (Topological overlap matrix):把邻接矩阵转换为拓扑重叠矩阵,以降低噪音和假相关,获得的新距离矩阵,这个信息可拿来构建网络或绘制TOM图。其定义依 据是任何两个基因的相关性不近由它们自己的相关性决定,还依赖于与这两个基因存在相关性的其它基因的互作,把这些因素都考虑进来,才能更好地定义基因表达谱的相似性。
$$
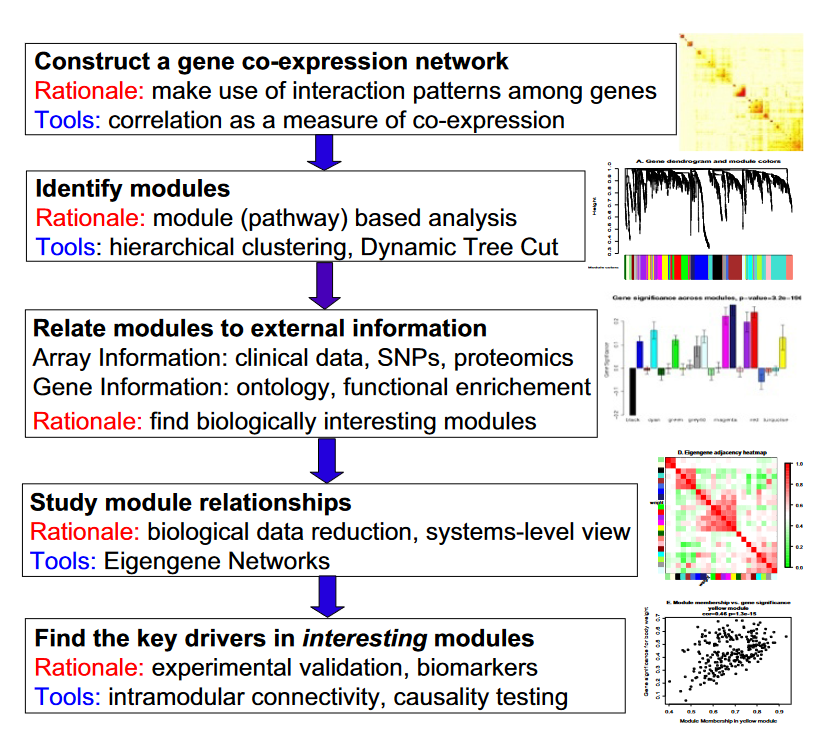
2基本分析流程
构建基因共表达网络:使用加权的表达相关性。
识别基因集:基于加权相关性,进行层级聚类分析,并根据设定标准切分聚类结果,获得不同的基因模块,用聚类树的分枝和不同颜色表示。
如果有表型信息,计算基因模块与表型的相关性,鉴定性状相关的模块。
研究模型之间的关系,从系统层面查看不同模型的互作网络。
从关键模型中选择感兴趣的驱动基因,或根据模型中已知基因的功能推测未知基因的功能。
导出TOM矩阵,绘制相关性图。
3 WGCNA包实战 R包WGCNA是用于计算各种加权关联分析的功能集合,可用于网络构建,基因筛选,基因簇鉴定,拓扑特征计算,数据模拟和可视化等。
a. 输入数据和参数选择
WGCNA本质是基于相关系数的网络分析方法,适用于多样品数据模式,一般要求样本数多于15 个。样本数多于20 时效果更好,样本越多,结果越稳定。
基因表达矩阵: 常规表达矩阵即可,即基因在行,样品在列,进入分析前做一个转置。RPKM、FPKM或其它标准化方法影响不大,推荐使用Deseq2的varianceStabilizingTransformation或log2(x+1)对标准化后的数据做个转换。如果数据来自不同的批次,需要先移除批次效应 (记得上次转录组培训课讲过如何操作)。如果数据存在系统偏移,需要做下quantile normalization。
性状矩阵:用于关联分析的性状必须是数值型 特征 (如下面示例中的Height, Weight, Diameter)。如果是区域或分类变量,需要转换为0-1 矩阵的形 式(1表示属于此组或有此属性,0表示不属于此组或无此属性,如样品分组信息WT, KO, OE)。
推荐使用Signed network和Robust correlation (bicor)。(这个根据自己的需要,看看上面写的每个网络怎么计算的,更知道怎么选择)
无向网络在power小于15或有向网络power小于30内,没有一个power 值可以使无标度网络图谱结构R^2达到0.8 或平均连接度降到100 以下,可能是由 于部分样品与其他样品差别太大造成的。这可能由批次效应、样品异质性或实验条件对表达影响太大等造成, 可以通过绘制样品聚类查看分组信息、关联批次信息、处理信息和有无异常样品 (可以使用之前讲过的热图简化,增加行或列属性 )。如果这确实是由有意义的生物变化引起的,也可以使用后面程序中的经验power 值。
ID
WT
KO
OE
Height
Weight
Diameter
samp1
1
0
0
1
2
3
samp1
1
0
0
2
4
6
samp1
0
1
0
10
20
50
samp1
0
1
1
15
30
80
samp1
0
1
1
NA
9
8
b 安装导入依赖的包及数据 1 2 3 4 5 6 7 8 9 10 11 12 13 14 15 16 17 18 19 20 21 22 23 24 25 26 27 28 29 30 31 32 library("BiocManager" ) install(c("AnnotationDbi" , "impute" ,"GO.db" , "preprocessCore" )) site="https://mirrors.tuna.tsinghua.edu.cn/CRAN" install.packages(c("WGCNA" , "stringr" , "reshape2" , "pheatmap" ), repos=site) library(WGCNA) library(reshape2) library(stringr) options(stringsAsFactors = FALSE) enableWGCNAThreads() type = "unsigned" corType = "bicor" corFnc = ifelse(corType=="pearson" , cor, bicor) maxPOutliers = ifelse(corType=="pearson" ,1,0.05) robustY = ifelse(corType=="pearson" ,T,F) dat_fpkm <- read_tsv(file = './data_fpkm.csv' ) dim(dat_fpkm)
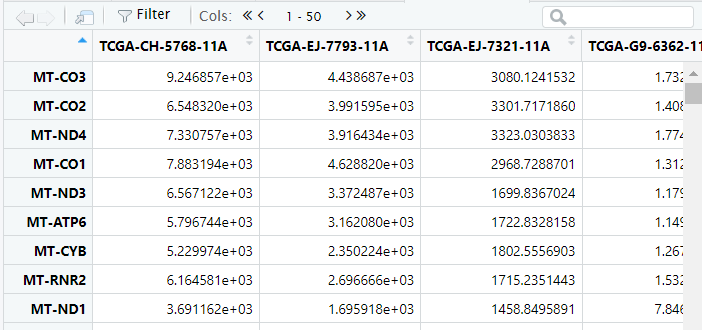
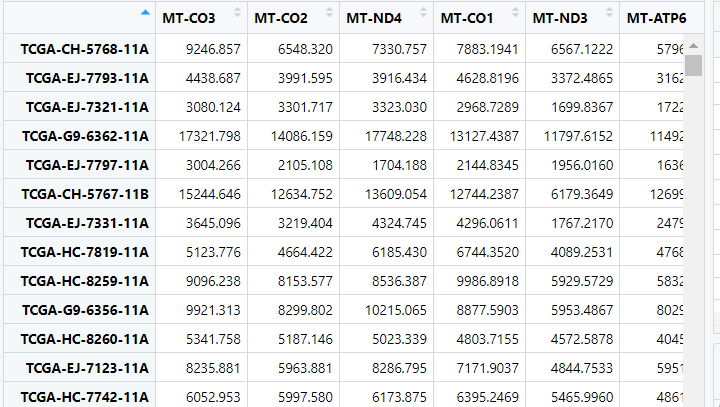
规范数据如图所示
c 数据基本处理 1 2 3 4 5 6 7 8 9 10 11 12 13 14 15 16 17 18 19 20 21 22 23 24 25 26 27 28 29 30 31 32 33 m.mad <- apply(dat_fpkm ,1,mad) dataExprVar <- dat_fpkm [which (m.mad > max(quantile(m.mad, probs=seq (0, 1, 0.25))[2],0.01)),] dataExpr <- as.data.frame(t(dataExprVar)) gsg = goodSamplesGenes(dat_fpkm , verbose = 3) if (!gsg$allOK ){ if (sum (!gsg$goodGenes )>0) printFlush(paste ("Removing genes:" , paste (names(dataExpr)[!gsg$goodGenes ], collapse = "," ))); if (sum (!gsg$goodSamples )>0) printFlush(paste ("Removing samples:" , paste (rownames(dataExpr)[!gsg$goodSamples ], collapse = "," ))); dataExpr = dataExpr[gsg$goodSamples , gsg$goodGenes ] } nGenes = ncol(dataExpr) nSamples = nrow(dataExpr) dim(dataExpr)
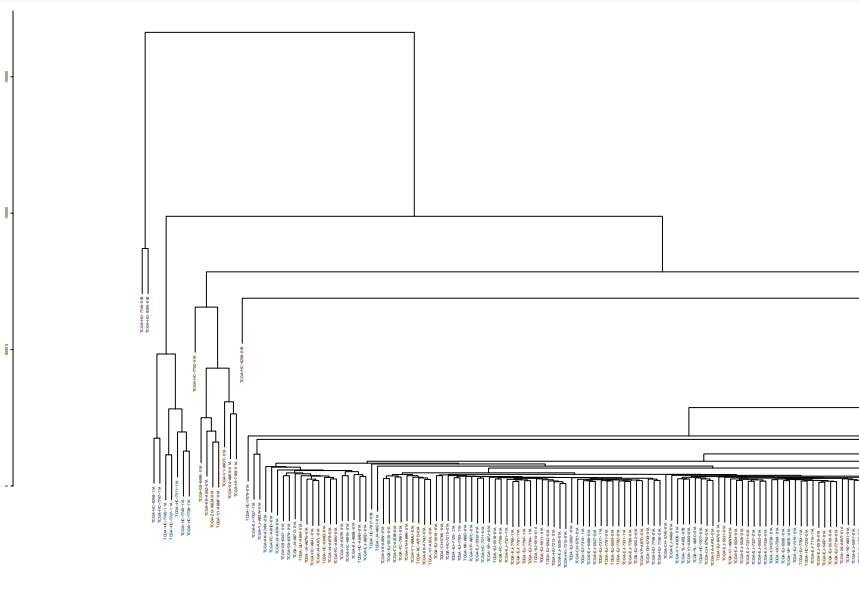
d 样本层级聚类,查看有无离群值 1 2 3 4 5 6 7 8 9 10 sampleTree = hclust(dist(dataExpr), method = "average" ) pdf(file="LiverFemaleClean.txt.pdf" , onefile=F, paper="special" , width=80, height=14, bg ="white" , pointsize=6) plot(sampleTree, main = "Sample clustering to detect outliers" , sub="" , xlab="" ) dev.off()
(部分,原图太大了)
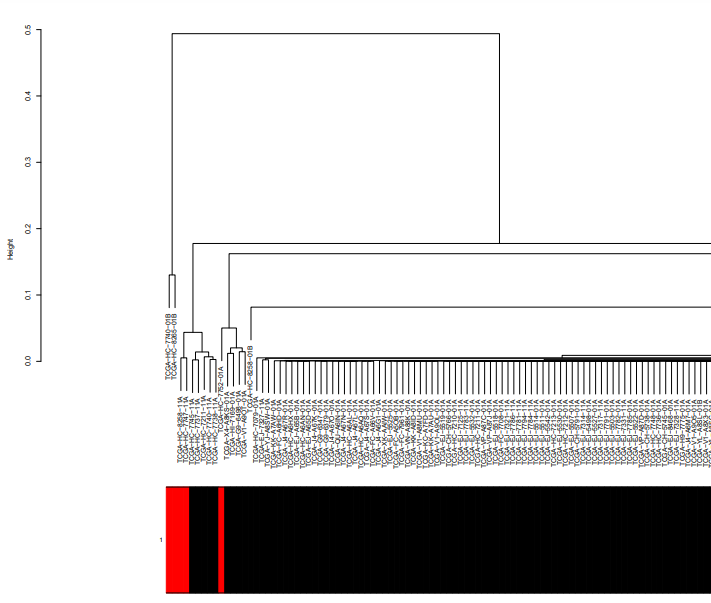
1 2 3 4 5 6 7 8 9 10 11 12 13 14 15 16 17 18 19 20 21 22 23 24 25 26 27 28 29 A = adjacency(t(dataExpr), type = "distance" ) k = as.numeric(apply(A, 2, sum )) - 1 Z.k = scale(k) thresholdZ.k = -5 outlierColor = ifelse(Z.k < thresholdZ.k, "red" , "black" ) sampleTree = hclust(as.dist(1 - A), method = "average" ) plotDendroAndColors(sampleTree, groupLabels = names(outlierColor), colors = outlierColor, main = "Sample dendrogram and trait heatmap" ) pdf(file = "plotDendroAndColorsAndTree.pdf" ,width=80, height=14) plotDendroAndColors(sampleTree, groupLabels = names(outlierColor), colors = outlierColor, main = "Sample dendrogram and trait heatmap" ) dev.off()
(部分)
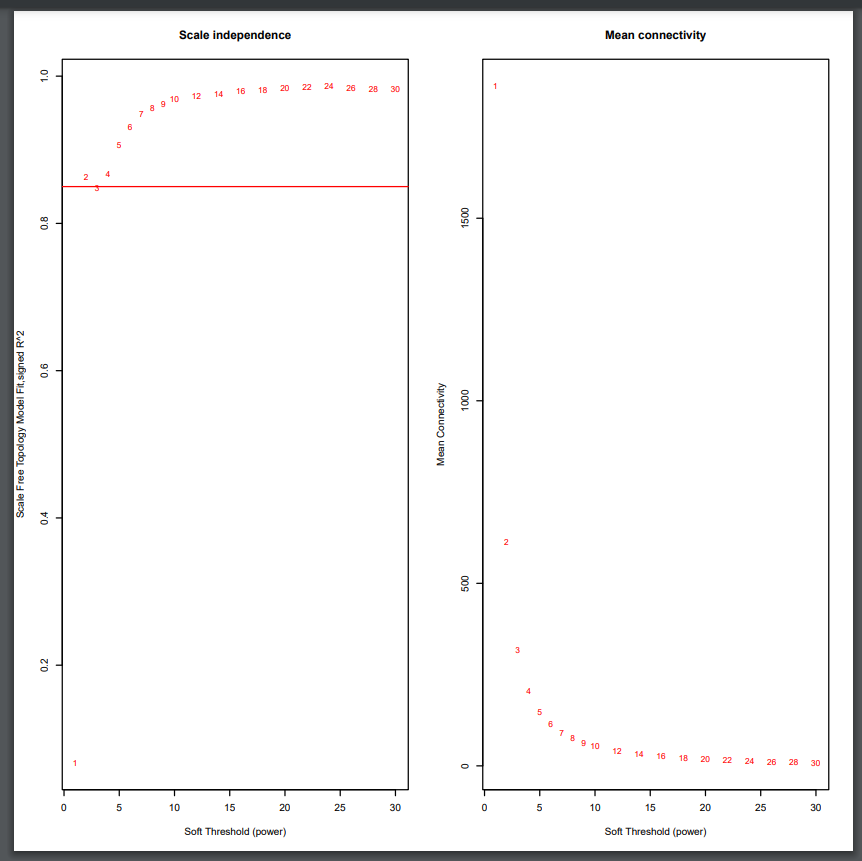
e 确定软阈值 1 2 3 4 5 6 powers = c(c(1:10), seq (from = 12, to=30, by=2)) sft = pickSoftThreshold(dataExpr, powerVector=powers, networkType=type , verbose=5)
1 2 3 4 5 6 7 8 9 10 11 12 13 14 15 16 17 18 19 20 21 22 23 24 25 26 27 28 29 30 31 32 33 34 35 36 37 38 39 40 41 42 43 44 45 46 47 48 par(mfrow = c(1,2)) cex1 = 0.9 plot(sft$fitIndices [,1], -sign(sft$fitIndices [,3])*sft$fitIndices [,2], xlab="Soft Threshold (power)" , ylab="Scale Free Topology Model Fit,signed R^2" ,type ="n" , main = paste ("Scale independence" )) text(sft$fitIndices [,1], -sign(sft$fitIndices [,3])*sft$fitIndices [,2], labels=powers,cex=cex1,col="red" ) abline(h=0.85,col="red" ) plot(sft$fitIndices [,1], sft$fitIndices [,5], xlab="Soft Threshold (power)" ,ylab="Mean Connectivity" , type ="n" , main = paste ("Mean connectivity" )) text(sft$fitIndices [,1], sft$fitIndices [,5], labels=powers, cex=cex1, col="red" ) pdf(file="LiverFemaleClean.txt.softpower.pdf" , onefile=F, paper="special" , bg ="white" , pointsize=6) par(mfrow = c(1,2)) cex1 = 0.9 plot(sft$fitIndices [,1], -sign(sft$fitIndices [,3])*sft$fitIndices [,2], xlab="Soft Threshold (power)" , ylab="Scale Free Topology Model Fit,signed R^2" ,type ="n" , main = paste ("Scale independence" )) text(sft$fitIndices [,1], -sign(sft$fitIndices [,3])*sft$fitIndices [,2], labels=powers,cex=cex1,col="red" ) abline(h=0.85,col="red" ) plot(sft$fitIndices [,1], sft$fitIndices [,5], xlab="Soft Threshold (power)" ,ylab="Mean Connectivity" , type ="n" , main = paste ("Mean connectivity" )) text(sft$fitIndices [,1], sft$fitIndices [,5], labels=powers, cex=cex1, col="red" ) dev.off() power = sft$powerEstimate power
1 2 3 4 5 6 7 8 9 10 11 12 13 14 15 16 17 18 if (is.na(power)){ print ("Using experience power since no suitable power found." ) power = ifelse(nSamples<20, ifelse(type == "unsigned" , 9, 18), ifelse(nSamples<30, ifelse(type == "unsigned" , 8, 16), ifelse(nSamples<40, ifelse(type == "unsigned" , 7, 14), ifelse(type == "unsigned" , 6, 12)) ) ) } print (paste ("Finally chooosed power is :" , power))
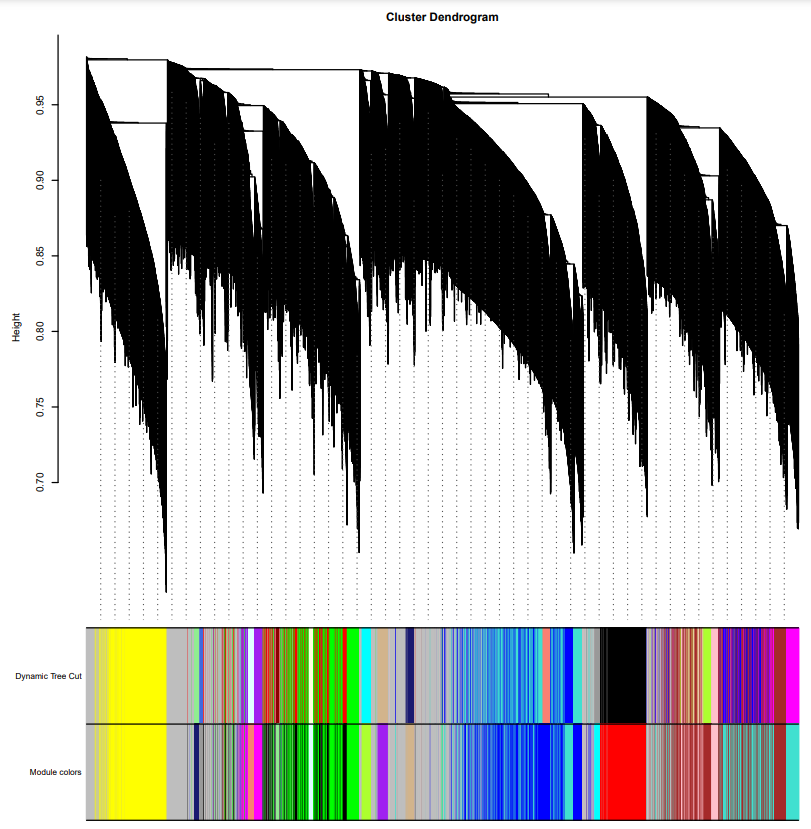
f 构建共表达网络 1 2 3 4 5 6 7 8 9 10 11 12 13 14 15 16 17 18 19 20 21 22 23 24 25 26 net = blockwiseModules(dataExpr, power = power, maxBlockSize = nGenes, TOMType = type , minModuleSize = 25, networkType = type , reassignThreshold = 0, mergeCutHeight = 0.2, numericLabels = TRUE, pamRespectsDendro = FALSE, saveTOMs=TRUE, corType = corType, maxPOutliers=maxPOutliers, loadTOM=TRUE, TOMDenom = "min" , deepSplit = 1, stabilityCriterion = "Individual fraction" , saveTOMFileBase = paste0("net.mid" , ".tom" ), verbose = 3, randomSeed=1117)
1 2 3 4 5 6 7 8 9 10 11 12 13 14 15 moduleLabels = net$colors moduleColors = labels2colors(moduleLabels) pdf(file="plotDendroAndColors.pdf" , onefile=F, paper="special" , bg ="white" , pointsize=6) dynamicColors <- labels2colors(net$unmergedColors ) plotDendroAndColors(net$dendrograms [[1]], cbind(dynamicColors,moduleColors), c("Dynamic Tree Cut" , "Module colors" ), dendroLabels = FALSE, hang = 0.5, addGuide = TRUE, guideHang = 0.05) dev.off()
g 共表达网络结果输出
输出基因及其所在模块信息,方便对模块进行富集分析。
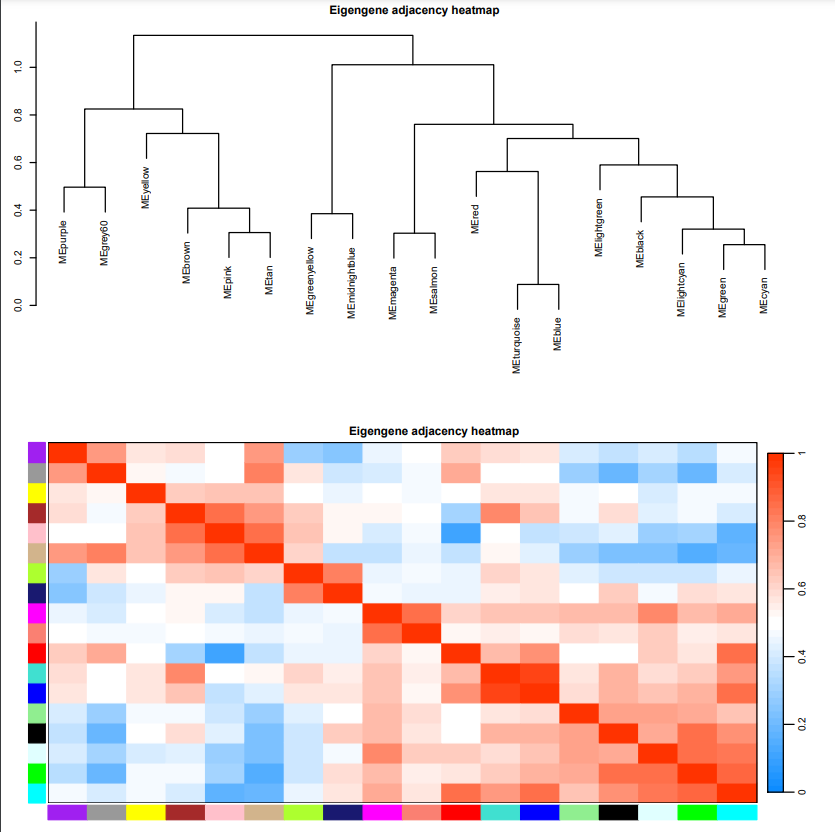
输出模块的主成分信息 (ME),代表模块整体基因表达量
1 2 3 4 5 6 7 8 9 10 11 12 13 14 15 16 17 18 19 20 21 22 23 24 25 26 27 28 29 30 31 32 33 34 35 36 37 38 39 40 gene_module <- data.frame(ID=colnames(dataExpr), module=moduleColors) gene_module = gene_module[order(gene_module$module ),] write.table(gene_module,file=paste0("finall.data" ,".gene_module.xls" ), sep="\t" ,quote=F,row.names=F) MEs = net$MEs MEs_col = MEs colnames(MEs_col) = paste0("ME" , labels2colors( as.numeric(str_replace_all(colnames(MEs),"ME" ,"" )))) MEs_col = orderMEs(MEs_col) MEs_colt = as.data.frame(t(MEs_col)) colnames(MEs_colt) = rownames(dataExpr) write.table(MEs_colt,file=paste0("finall.data" ,".module_eipgengene.xls" ), sep="\t" ,quote=F) pdf(file="plotEigengeneNetworks.pdf" , onefile=F, paper="special" , bg ="white" , pointsize=6) plotEigengeneNetworks(MEs_col, "Eigengene adjacency heatmap" , marDendro = c(3,3,2,4), marHeatmap = c(3,4,2,2), plotDendrograms = T, xLabelsAngle = 90) dev.off() R.devices::toPDF("plotEigengeneNetworks.pdf" , { plotEigengeneNetworks(MEs_col, "Eigengene adjacency heatmap" , marDendro = c(3,3,2,4), marHeatmap = c(3,4,2,2), plotDendrograms = T, xLabelsAngle = 90) })
h 筛选Hub基因 1 2 3 4 hubs = chooseTopHubInEachModule(dataExpr, colorh=moduleColors, power=power, type =type ) hubs con <- nearestNeighborConnectivity(dataExpr, nNeighbors=50, power=power, type =type , corFnc = corType)
i 获取TOM矩阵,导出Cytoscape可用的数据方便网络图绘制 1 2 3 4 5 6 7 8 9 10 11 12 13 14 15 16 17 18 19 20 21 22 23 24 25 26 27 28 29 30 31 32 load(net$TOMFiles [1], verbose=T) TOM <- as.matrix(TOM) dissTOM = 1-TOM plotTOM = dissTOM^power diag(plotTOM) = NA probes = colnames(dataExpr) dimnames(TOM) <- list(probes, probes) exprMat <- "finall.data" cyt = exportNetworkToCytoscape(TOM, edgeFile = paste ("finall.data" , ".edges.txt" , sep="" ), nodeFile = paste (exprMat, ".nodes.txt" , sep="" ), weighted = TRUE, threshold = 0.01, nodeNames = probes, nodeAttr = moduleColors)
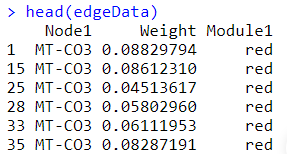
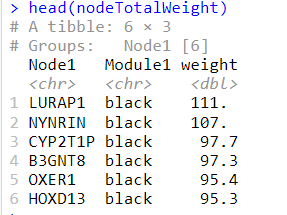
j 筛选Hub基因2 1 2 3 4 5 6 7 8 9 10 11 12 library(dplyr) edgeData1 <- cyt$edgeData [,c(1,2,3)] edgeData2 <- cyt$edgeData [,c(2,1,3)] nodeattrib <- cyt$nodeData [,c(1,3)] colnames(nodeattrib) <- c("nodeName" , "Module" ) colnames(edgeData1) <- c("Node1" ,"Node2" ,"Weight" ) colnames(edgeData2) <- c("Node1" ,"Node2" ,"Weight" ) edgeData <- rbind(edgeData1, edgeData2) edgeData$Module1 <- nodeattrib[match(edgeData$Node1 , nodeattrib$nodeName ), 2] edgeData$Module2 <- nodeattrib[match(edgeData$Node2 , nodeattrib$nodeName ), 2] edgeData <- edgeData[edgeData$Module1 ==edgeData$Module2 ,c(1,3,4)] head (edgeData)
1 2 3 4 nodeTotalWeight <- edgeData %>% group_by(Node1, Module1) %>% summarise(weight=sum (Weight)) nodeTotalWeight <- nodeTotalWeight[with(nodeTotalWeight, order(Module1, -weight)),] head (nodeTotalWeight)
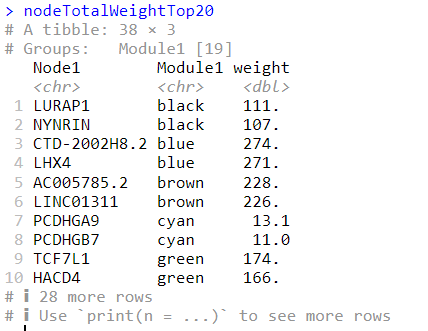
1
2
nodeTotalWeightTop20 = nodeTotalWeight %>% group_by(Module1) %>% top_n(2, weight) nodeTotalWeightTop20
k表型关联分析 (有表型数据可做) 1 2 3 4 5 6 7 8 9 10 11 12 13 14 15 16 17 18 19 20 21 22 23 24 25 26 27 28 29 30 31 32 33 34 35 36 37 38 39 40 41 42 43 44 45 46 47 48 49 50 51 52 53 54 55 56 57 58 59 60 61 62 63 64 65 66 67 68 69 70 71 72 73 74 75 if (trait != "" ) { sampleName = rownames(dataExpr) traitData = traitData[match(sampleName, rownames(traitData)), ] traitColors = numbers2colors(traitData, signed = FALSE); plotDendroAndColors(sampleTree, traitColors, groupLabels = names(traitData), main = "Sample dendrogram and trait heatmap" ) MEs_colpheno = orderMEs(cbind(MEs_col, traitData)) plotEigengeneNetworks(MEs_colpheno, "Eigengene adjacency heatmap" , marDendro = c(3,3,2,4), marHeatmap = c(3,4,2,2), plotDendrograms = T, xLabelsAngle = 90) if (corType=="pearsoon" ) { modTraitCor = cor(MEs_col, traitData, use = "p" ) modTraitP = corPvalueStudent(modTraitCor, nSamples) } else { modTraitCorP = bicorAndPvalue(MEs_col, traitData, robustY=robustY) modTraitCor = modTraitCorP$bicor modTraitP = modTraitCorP$p } textMatrix = paste (signif(modTraitCor, 2), "\n(" , signif(modTraitP, 1), ")" , sep = "" ) dim(textMatrix) = dim(modTraitCor) pdf(file="labeledHeatmap.pdf" , onefile=F, paper="special" , pointsize=6) labeledHeatmap(Matrix = modTraitCor, xLabels = colnames(traitData), yLabels = colnames(MEs_col), cex.lab = 0.5, ySymbols = colnames(MEs_col), colorLabels = FALSE, colors = blueWhiteRed(50), textMatrix = textMatrix, setStdMargins = FALSE, cex.text = 0.5, zlim = c(-1,1), main = paste ("Module-trait relationships" )) dev.off() labeledHeatmap(Matrix = modTraitCor, xLabels = colnames(traitData), yLabels = colnames(MEs_col), cex.lab = 0.5, ySymbols = colnames(MEs_col), colorLabels = FALSE, colors = blueWhiteRed(50), textMatrix = textMatrix, setStdMargins = FALSE, cex.text = 0.5, zlim = c(-1,1), main = paste ("Module-trait relationships" )) modTraitCorMelt = as.data.frame(modTraitCor) write.table(modTraitCorMelt,file=paste0(exprMat,".module_trait_correlation.xls" ), sep="\t" ,quote=F) modTraitCorMelt$ID = rownames(modTraitCor) modTraitCorMelt = melt(modTraitCorMelt) colnames(modTraitCorMelt) <- c("Module" ,"Trait" ,"PersonCorrelationValue" ) modTraitPMelt = as.data.frame(modTraitP) write.table(modTraitPMelt,file=paste0(exprMat,".module_trait_correlationPvalue.xls" ), sep="\t" ,quote=F) modTraitPMelt$ID = rownames(modTraitP) modTraitPMelt = melt(modTraitPMelt) colnames(modTraitPMelt) <- c("Module" ,"Trait" ,"Pvalue" ) modTraitCorP = merge(modTraitCorMelt, modTraitPMelt, by=c("Module" ,"Trait" )) write.table(modTraitCorP,file=paste0(exprMat,".module_trait_correlationPvalueMelt.xls" ), sep="\t" ,quote=F,row.names=F) }
三、WGCNA原理解析 该解析来源于
WGCAN原理的提出者文章:
Zhang, Bin, and Steve Horvath. “A general framework for weighted gene co-expression network analysis.” Statistical applications in genetics and molecular biology 4.1 (2005).WGCAN R语言实现文章
Langfelder, Peter, and Steve Horvath. “WGCNA: an R package for weighted correlation network analysis.” BMC bioinformatics 9 (2008): 1-13.
WGCAN处理流程
宋长新,雷萍,王婷.基于WGCNA算法的基因共表达网络构建理论及其R软件实现[J].基因组学与应用生物学,2013,32(01):135-141.
1.WGCAN流程如下图 以下对上两部进行讲解
2.构建共表达网络 这一步是利用了利用基因之间的相互作用模式,来得到他们之间的关系。并且以相关性作为共表达的度量。


